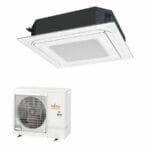
 Cassette Split Systems
 Safety Gloves
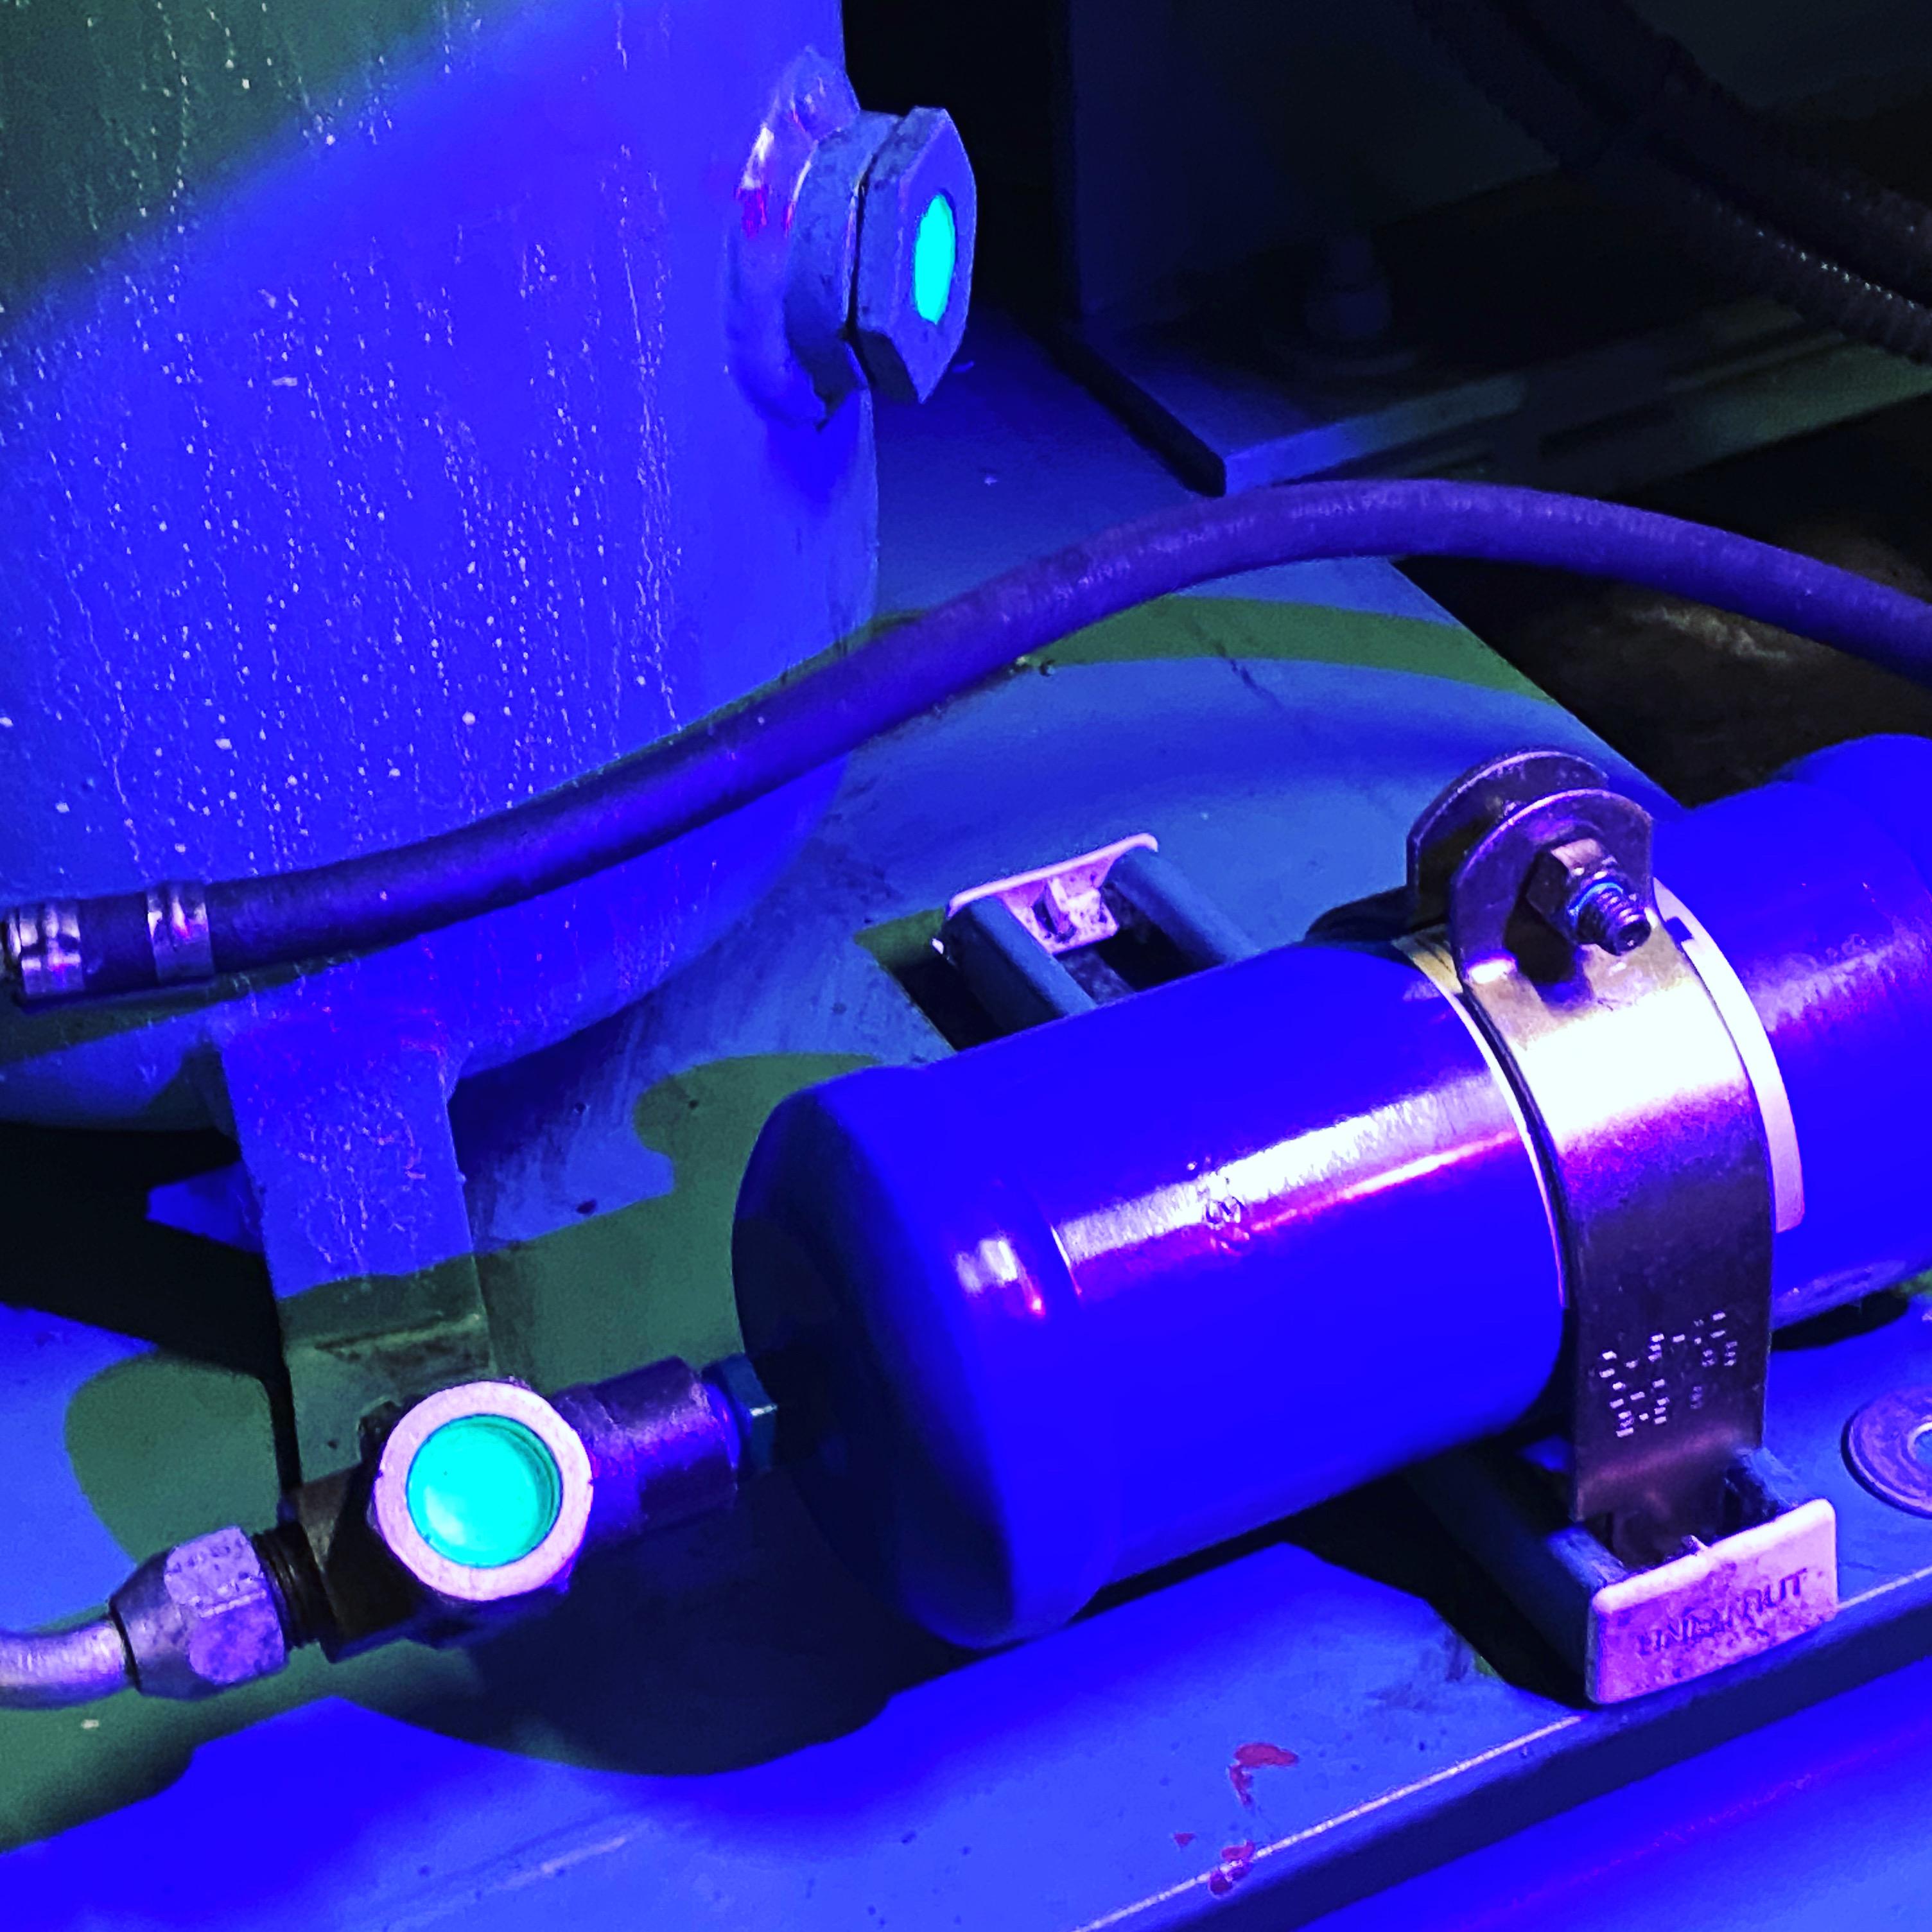 UV Leak Detection
 Condensate Drain Pipe
 Nitrogen Regulators
 Filter Driers
 Filter Cores for Core Shells
MASTERCLASS – AIR CONDITIONING TECHNOLOGY
Volume 35 – Psychrometrics
In last month’s volume 34, we completed the study of various approaches to capacity control. This month we move on the subject of Psychrometrics.
PSYCHROMETRICS
Part 1.
The definition of psychrometrics can be said to be the study of dry air and water vapour mixtures. Having covered the mechanics of refrigeration we may now apply this knowledge to cool a given space.
The only source of cooling on any air conditioning system is the evaporator coil. Therefore, in order to remove heat from the space the heat must be transported in some way to the evaporator and the obvious medium used is the air contained by the room which is recirculated through the evaporator coil by the fan within the air-handling unit.
In order to determine the quantity of air that has to pass through the evaporator we have to know the total amount of heat that has to be removed. This total quantity of heat energy comprises two forms, namely a given amount of sensible heat and the remaining amount of latent heat. It is essential to the efficiency of any air conditioning system for the heat gain calculations for the conditioned space to be as accurate as possible. The heat gain calculation will determine the absolute maximum amounts of sensible and latent heat gains to the space together with peak time of day and month of year. These two figures, sensible and latent heat, will determine both the characteristics of the evaporator and size of the air-handler.
In order to design the “air side” of an air conditioning system we need to know the heat carrying capability of the air. There are a number of ways of establishing these characteristics including use of Steam Tables and Psychrometric Charts. We will concentrate on the Psychrometric Chart.
To start with we will briefly examine the structure of a Psychrometric Chart and see how the various processes are displayed on the chart. Fig.1 shows a skeleton chart that contains the outlines of the major functions. Note that there are several variations of Psychrometric Chart but that they all contain essentially the same characteristics:
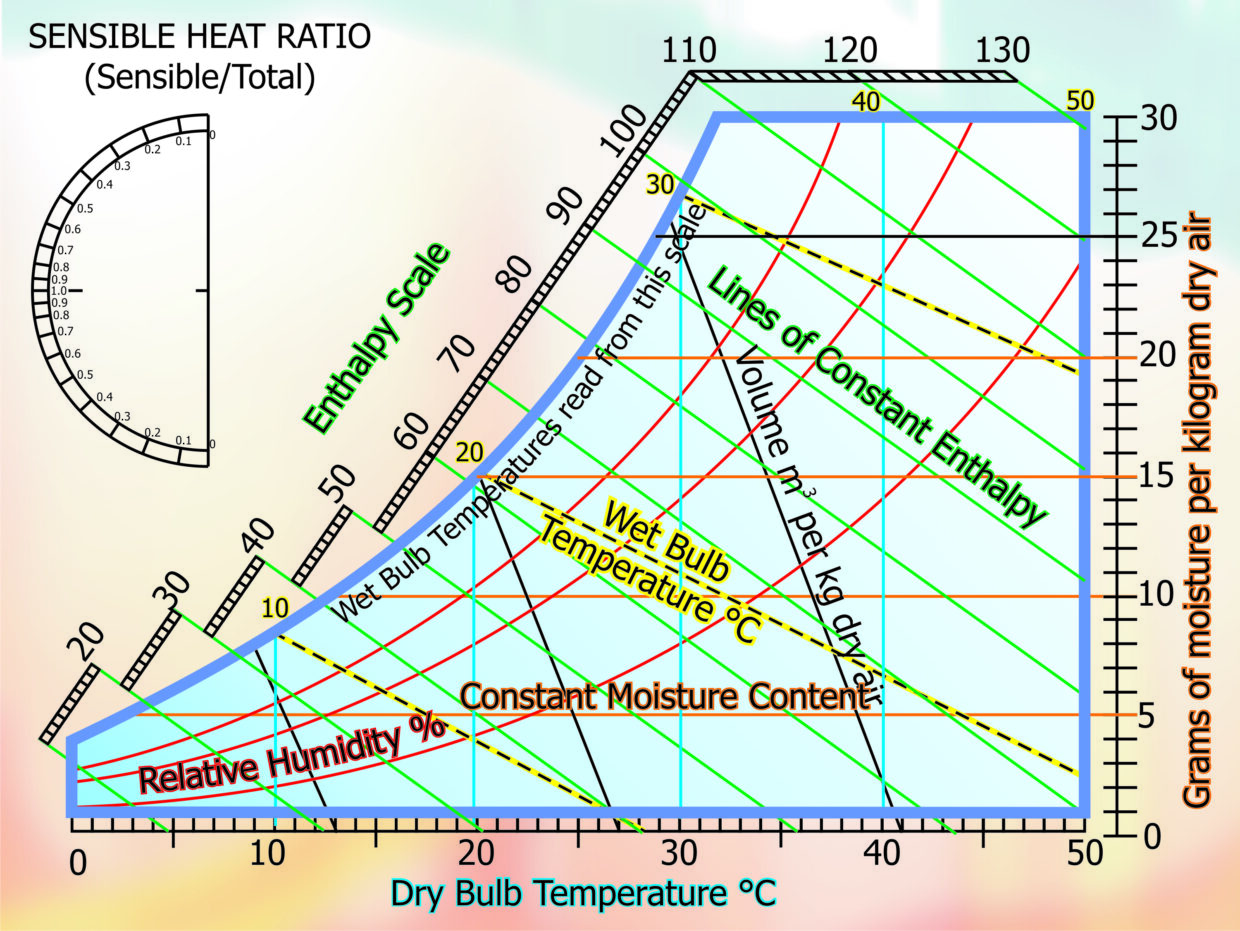
Fig.1 (Not to scale)
Dry bulb (db) temperatures are read vertically from the X axis, until the db temperature lines intersect the Saturation Curve (or wet bulb (wb) curve. For example, the 20°C db line intersects the wb curve at 20°C. However wb lines slope diagonally to the right and the 20°C wb line intersects all dry bulb temperatures greater than 20°C.
Horizontal lines intersecting the Y1 axis shows the moisture content of the air, in this example in grams of moisture per kilogram (g/kg) of dry air. This is also known as Absolute Humidity.
The Specific Enthalpy of the air is read from the enthalpy scale in kJ/kg. In fig.1, the slope of these lines has been exaggerated in order to emphasis the difference from the wet bulb lines. When working with true psychrometric charts care should be taken to avoid confusion between wb lines and specific enthalpy lines. Some charts use a separate set of scales external to the body of the chart and one uses a straight edge on these scales to determine the value within the area of the chart. Some American charts use the same lines for specific enthalpy and wet bulb.
Superimposed on the chart are lines of constant volume better termed Specific Volume. These lines show the specific volume of the air in m3/kg. Constant volume lines are usually shown widely spaced and readings have to be interpolated for a given condition.
Percentage Saturation (more popularly known as Relative Humidity – %.RH) is shown as dashed lines in fig.1 in order to differentiate between all the other lines shown on the chart and is termed %SAT.
Most charts enable the plotting of the sensible heat ratio (SHR) line. In fig.1 this would be achieved by transposing the process curve from the main body of the chart to the protractor shown upper left.
The processes that can be displayed and calculated from a psychrometric chart are shown in fig.2.
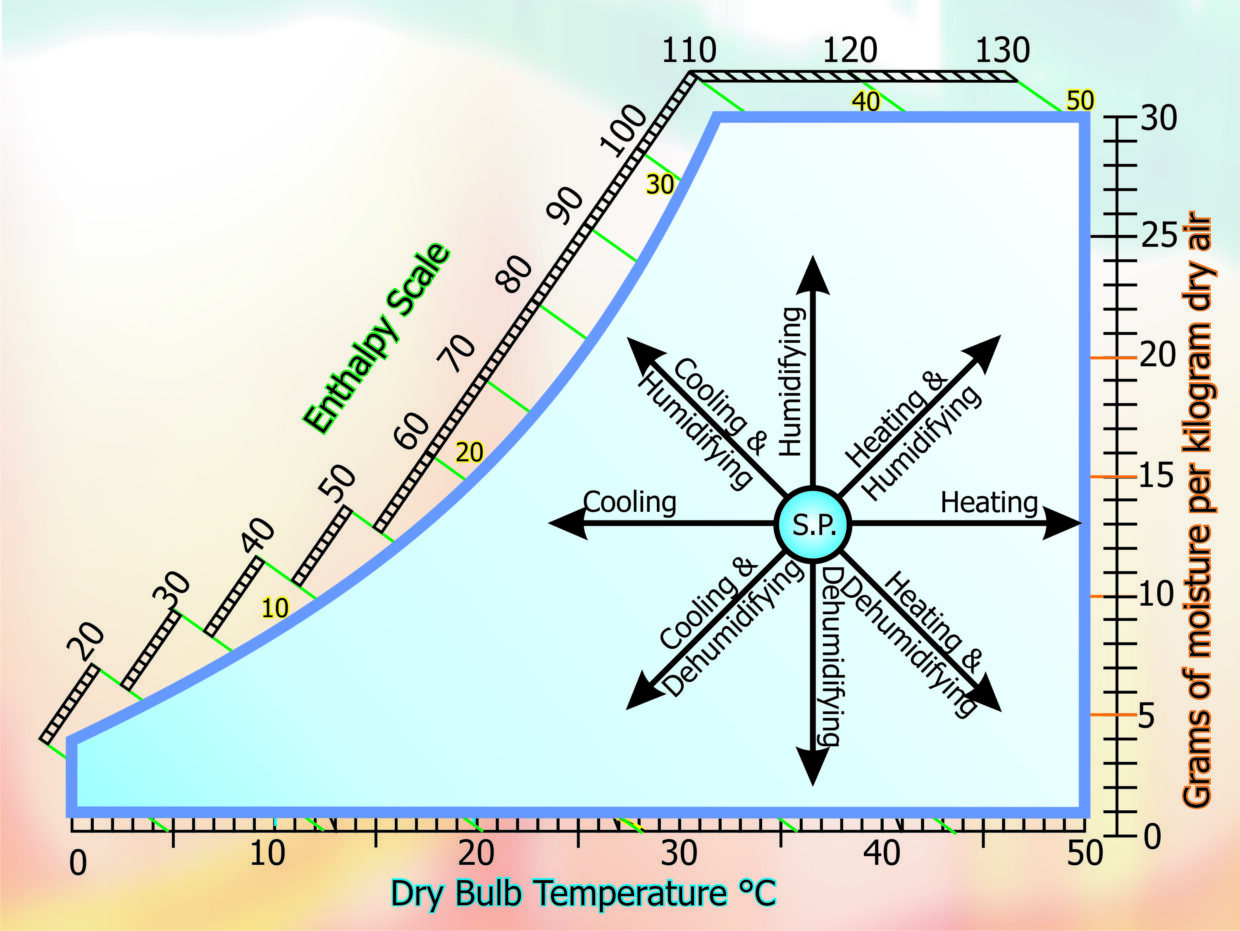
Fig.2.
If the starting point of the process is at (SP) on the chart and sensible heat only is applied or added to the air then a horizontal line moving to the right of (SP) displays the characteristics of the air. Conversely, if sensible heat energy only is removed from the air, the air is reduced in temperature and is therefore cooled without any change in moisture content. This sensible cooling process results in a horizontal line to the left of (SP).
The addition of latent heat to air results in an increase in moisture content (humidification). The removal of latent heat energy has the reverse effect (dehumidification).
Any process that involves an increase in the moisture content (humidification) of the air is displayed by a line moving above the (SP) point, while any process that decreases the moisture content of the air can be shown by a line moving below the (SP) point. Therefore combinations of heating or cooling combined with changes in the moisture content can be displayed by lines sloping upwards or downwards from the (SP) point.
To place the statements made above into context we will examine the process displayed in fig.3, which shows a cooling process from a starting point (A) to finishing point (B). We are given point (A) as 27°C.db, 50%SAT, and point (B) as 21°C.db, 17°C.wb. Total cooling duty is 200kW.
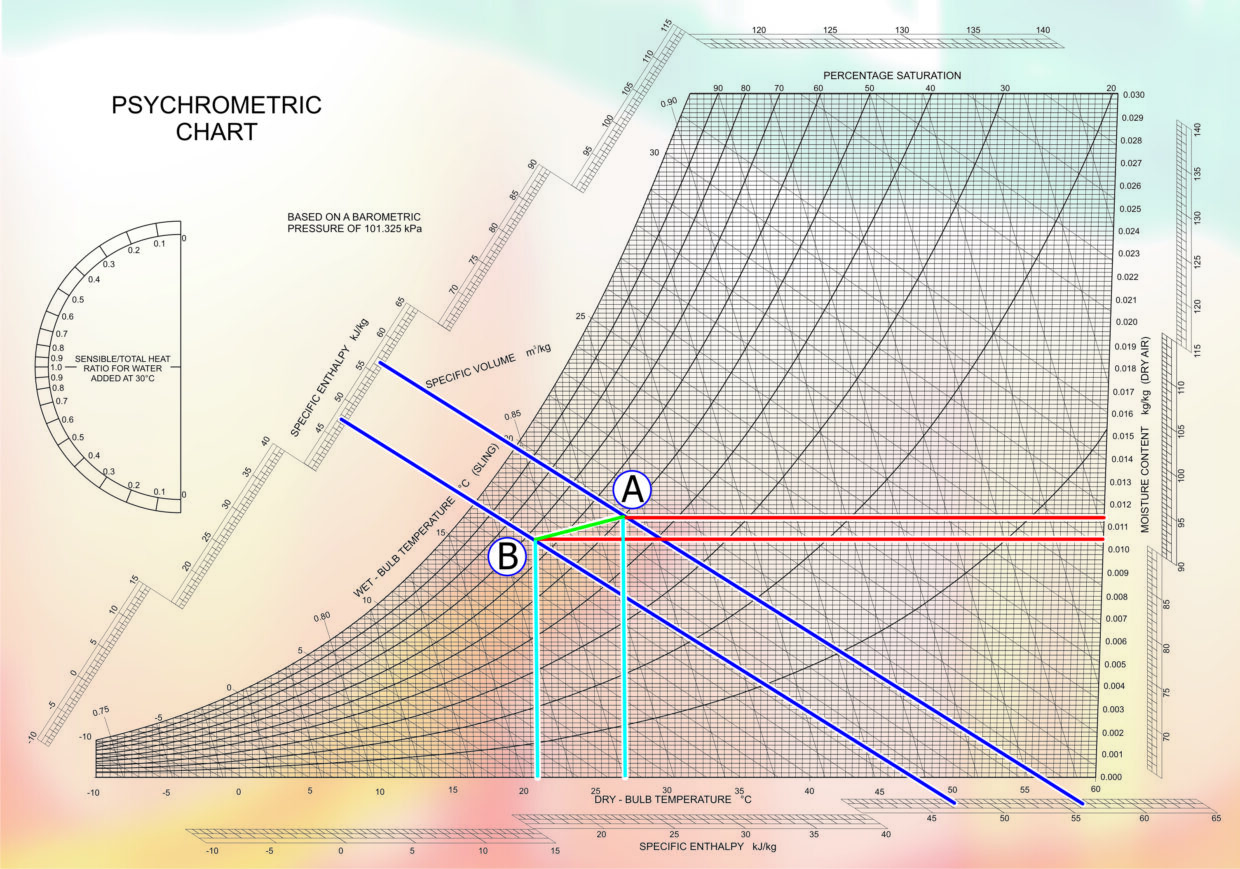
Fig.3
Given the above information we can calculate the amount of sensible heat and latent heat (moisture content) that is removed and how much air has to be circulated through the evaporator to achieve the cooling duty.
Sensible Heat & Latent Heat (Moisture) removed:
Condition of air at (A): Enthalpy = 56.5 kJ/kg Moisture Content = 0.0114 kg/kg.
Condition of air at (B): Enthalpy = 47.5 kJ/kg Moisture Content = 0.0104 kg/kg.
Enthalpy difference (A) – (B) = 9.0 kJ/kg.
Moisture difference (A) – (B) = 0.0010 kJ/kg.
Air & Moisture Circulated
Then mass flow required = 200 kW/ (9.0 / 3600) = 80000.0 kg/h.
Density of air entering evaporator = 0.86 m3/kg.
Volume of air required = 80000.0 x 0.866 = 69280 m3/h.
or 19.24 m3/s.
Moisture removed = 80000.0 x 0.001 = 80.0 kg/h.
To establish the SHR (Sensible heat / Total heat) of the load on the evaporator, three methods can be used.
Method 1
The simplest is to use the derived factor 1.2 as in the formula;
qs = 1.2 x m3/s x (t1 – t2)
Where qs is sensible heat in kilowatts and t1 is air db temperature at (A) and t2 is db temperature at (B).
Therefore qs = 1.2 x 19.24 x ( 27 – 21 ) = 138.56 kW.
And SHR = 138.56 / 200 = 0.693 or 69.3%.
Method 2
The second method is to use a combination of set squares or parallel rulers and transpose the angle of the line drawn between (A) and (B) up to the sensible heat quadrant and read off the sensible heat ratio.
Method 3
The third method is to draw a horizontal line from (A) until it intersects the dry bulb line for 21°C. and then read off the enthalpy conditions at these two points. Then the following formula can be applied;
qs = (v / d) x (h1 – h2)
Where v = volume of air in m3/s, d = density of air m3/kg, h1 enthalpy of air at (A) and h2 enthalpy of air at intersection of 21°C db line.
h1 = 56.5 kJ/kg
h2 = 50.0 kJ/kg
qs = (19.24 / 0.866) x (56.5 – 50.0) = 144.41 kW
SHR = 144.41 / 200 = 72.2%
The third method is the more accurate but the difference between methods 1 and 3 is less than 3% which is relatively small and is due to the derived factor of 1.2 being based on standard air. Method 2 is subject to the accuracy of transposing the cooling curve and the detail shown on the quadrant and is therefore only useful as a check.
As can be seen from method 1, sensible heat determines the air volume to be circulated through the system and latent heat is controlled by evaporator design and evaporation temperature. In order to achieve the most efficient system it is important that the calculations accurately reflect the room characteristics and the selection of equipment matches the SHR. By matching the sensible ratio there will be no unnecessary humidification or dehumidification, both of which result in greater energy consumption.
While a fully engineered system can be designed to match the required characteristics, this is not always possible when installing standard packaged equipment, where the SHR of the equipment is significantly different to that required. Under these circumstances the selection of equipment should be based on matching the calculated air volume, not the total cooling capacity of the packaged unit. The reason for this can be easily seen by exaggerating the slope of the SHR curve (say to 40%) in the above example, then extending it to reach the required dry bulb temperature. If the new conditions are calculated it will be seen that the total cooling duty will now very much greater in order to achieve the required dry bulb temperature. Therefore if a packaged system had been selected on the basis of having a total cooling capacity of 200 kW but had an SHR of say 63% it would not be able to achieve the required room temperature.
Proof:
Transposing qs = 1.2 x v x td, where td = Air on to evaporator minus Air off evaporator.
Assume SHR 63% of total duty 200 kW = 126 kW = sensible heat, then:
td = 126 / (1.2 x 19.24) = 5.46 °K
therefore = 27 – 5.46 = 21.5 °C air off.
While in this instance the difference is only 0.5°C the effect will be compounded in as much that the air on condition will rise and subsequently the air off will rise further.
Note: Psychrometric conditions vary with barometric pressure. Most charts will state the pressure on which the data is based. Standard charts are based on a pressure of 101.325 kPa.
Now that the basis of arriving at air volume has been covered we will look at the mixing of two streams of air to establish the resultant condition.
Assume that of the total volume of air circulated in the above example 10% was fresh air at 32°C db and 25.8°C wb. We then have 1.924 m3/s at 32°Cdb, 25.8°C.wb and 17.316 m3/s at 27°C.db and 19.85°C.wb.(50% rh). We can calculate the actual mixed condition of the air entering the duct using the following methods:
Method 1. (Approximating mixed condition)
This method is an approximation since it does not take into consideration the different densities of the ambient air and re-circulated air.
Mark the two points on the psychrometric chart and join together with a straight line and measure the length of the line. Calculate the equivalent of 10% of the line length. Mark this length from the 27°Cdb/17°Cwb point and this will locate the mixed condition of the air. If there is uncertainty from which point to locate the 10% mark on the line, simple logic will indicate that since 90% of the air volume is at 27°C and only 10% at 32°C, the mixed condition will be closer to 27°C than 32°C.
The resultant mixed condition will be 27.6°C wb. 20.6°C wb.
Method 2.
Method 2 is more accurate because air densities are taken into consideration.;
Mark on the chart the two points, ambient air condition and re-circulated air condition.
From the psychrometric chart establish the density of the air at these two points;
Fresh air density is 0.89 m3/kg. and re-circulated air 0.866 m3/kg.
Mass flow fresh air = 1.924 m3/s / 0.89 m3/kg = 2.16 kg/s
Mass flow re-circulated air = 17.316 m3/s / 0.866 m3/kg = 20.0 kg/s
Total mass flow of air = 22.16 kg/s
Dry air mix = 20.0 kg/s / 22.16 kg/s * 27 = 24.368 °C
= 2.16 kg/s / 22.16 kg/s * 32 = 3.119 °C
Dry bulb condition of mixed air = 24.368 + 3.119 = 27.487 °C.
To establish wet bulb point of mixed air draw a vertical line from the dry bulb point until it intersects the line between the fresh air and re-circulated air conditions, read the wet bulb temperature at the point of intersection. In this example the result is virtually identical to the result in Method 1, i.e. 20.6°C.
NEXT MONTH: Volume 36 – In the next article we will examine duct design.
DISCLAIMER: Whilst every effort is made to ensure absolute accuracy, Business Edge Ltd. will not accept any responsibility or liability for direct or indirect losses arising from the use of the data contained in this series of articles.